
Build a quality dashboard
A dashboard is the screen your shift actually looks at. Start from a template and change what does not fit.
Before you start
Section titled “Before you start”- Data flowing from at least one device
- A question in mind — “how is Line 3 doing this shift?” beats “let’s make a dashboard”
1. Start from a template
Section titled “1. Start from a template”Open Monitoring and select New Dashboard. Templates are offered up front.
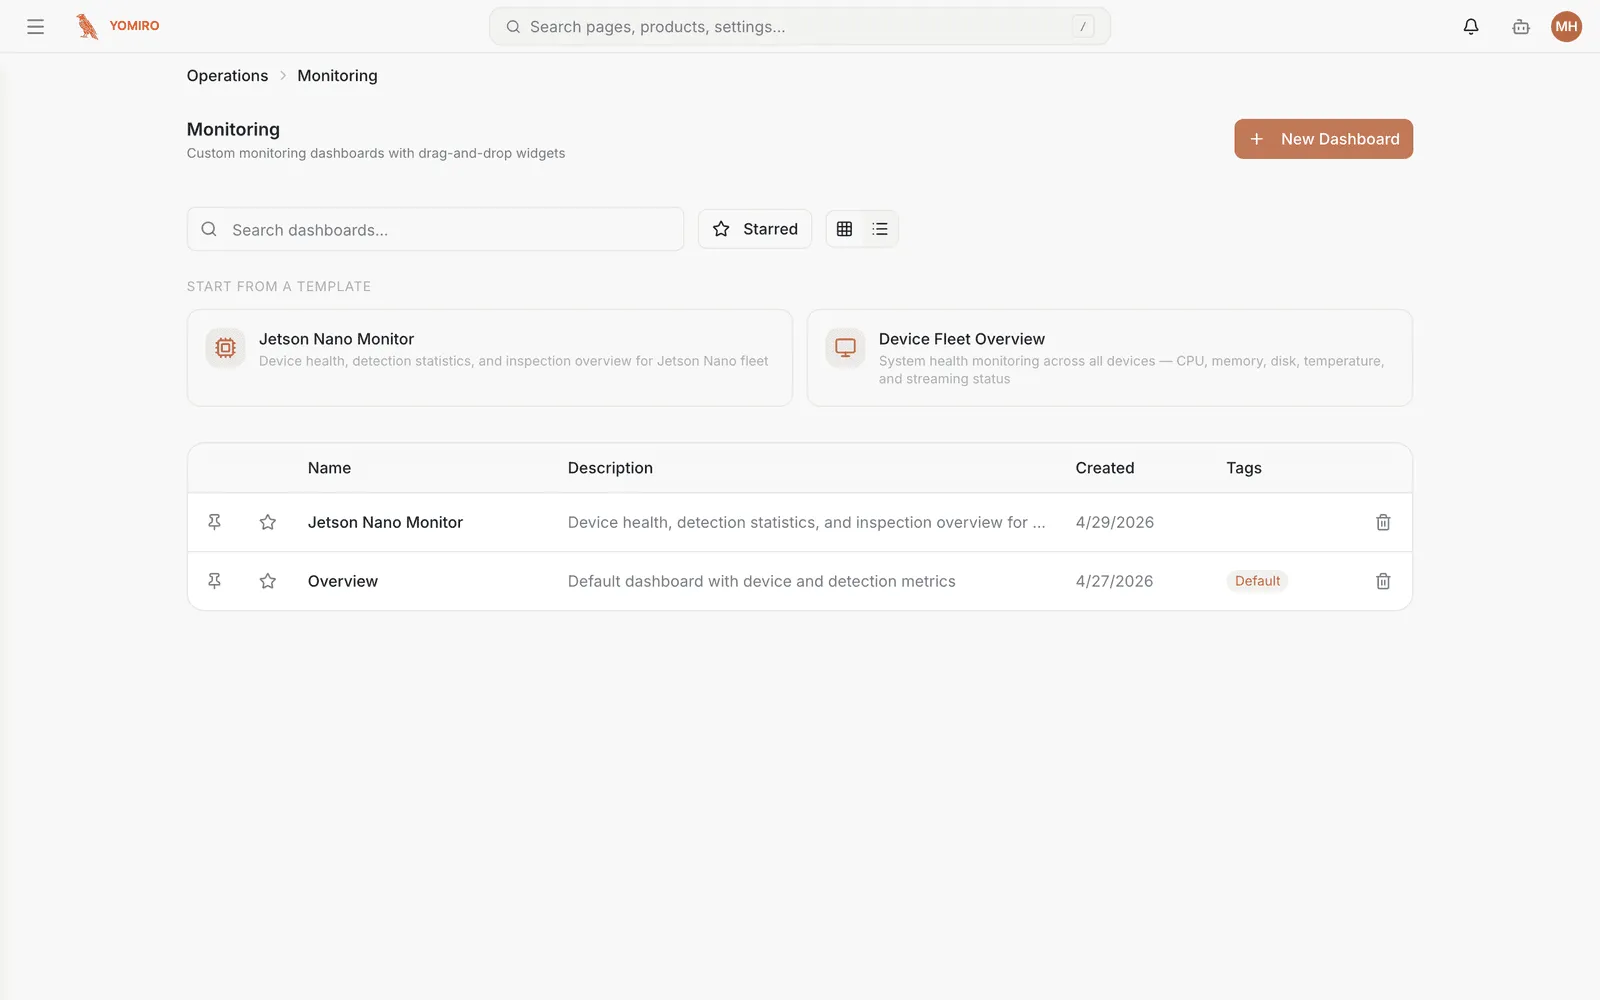
Take a template if one is close. It is faster to delete two widgets than to build six, and the defaults reflect how these metrics are normally read.
2. Work out the question first
Section titled “2. Work out the question first”For anything a template does not cover, go to Explore before you add a widget.
Explore is the scratchpad: write the query, run it, look at the answer, change it. Once a query earns its keep, Add to Dashboard turns it into a permanent widget.
Building widgets directly on the dashboard means editing in the place everyone is looking. Get it right in Explore, then publish.
3. Choose the right shape
Section titled “3. Choose the right shape”| Widget | Use when |
|---|---|
| Time series | The question is about change — defect rate, throughput, temperature |
| Bar chart | You are comparing categories — defects by type, output by line |
| Table | You need exact values, not a shape |
| Gauge | It is one number against a target |
| Pie chart | It is composition, with few enough slices to read |
Most operational questions are “is this getting worse?”, which is a time series. Reach for a pie chart rarely.
4. Lay it out for the person reading it
Section titled “4. Lay it out for the person reading it”Drag widgets to move them and drag their edges to resize.
Put what matters top-left. Somebody glancing at a wall screen between tasks reads one or two things, not nine — so decide what those are and give them the space.
5. Come back from the dashboard
Section titled “5. Come back from the dashboard”Any widget offers Open in Explore, which reloads that widget’s query in the scratchpad. Use it when a dashboard raises a question instead of answering one — which is what a good one does.
Next steps
Section titled “Next steps”- Get alerted rather than watching a number
- Monitoring reference · Explore reference